A$addDir(480, 4, "Area", "IntDen",
         "data/GFP/GFP Secondary Neurite",
         "data/GFP/GFP Secondary Neurite Control",
         "data/GFP/GFP Secondary Neurite Back")

B$addDir(480, 4, "Area", "IntDen",
         "data/LIFEACT GFP/LIFEACT GFP Secondary Neurite",
         "data/LIFEACT GFP/LIFEACT GFP Secondary Neurite Control",
         "data/LIFEACT GFP/LIFEACT GFP Secondary Neurite Back")

C$addDir(480, 4, "Area", "IntDen",
         "data/LIFEACT GFP/LIFEACT GFP Dendrite",
         "data/LIFEACT GFP/LIFEACT GFP Dendrite Control",
"data/LIFEACT GFP/LIFEACT GFP Dendrite Back")Import data FRAP
Once the data groups are initialized, it’s time to add the information. One way to do this is through the addDir function of the newDataFrap object. This function requires the user to organize the FRAP tables into three files on their computer: the first one with the recovery data, the second one with the control tables, and the third one with the background information.
The addDir function in the fraping package accepts the following parameters to add the information from the FRAP data files:
seconds: Duration of the experiment in seconds.photo: Frame index where photobleaching is applied.areaColumn: Name of the column containing the area data.inputColumn: Name of the column containing the intensity data.dirR: Path to the recovery data file.dirC: Path to the control data file.dirB: Path to the background data file (optional).
It’s important to note that the background data is optional. If you decide to omit the background data file, you should consider that this will have a direct impact on the data standardization during the analysis.
Here’s an example of how to use the addDir function:
When creating a new data group using the newDataFrap function, a random color is automatically assigned to the group. This color is used to differentiate it from others in the plots. If you want to assign a specific color to the group, you can use the setColor function of the newDataFrap object. This function accepts the color value in hex format as a parameter, or you can choose a predefined color from the grDevices::colors() vector or use the color function from the itz package.
A$setColor("#05753D")
B$setColor("#0000A6")
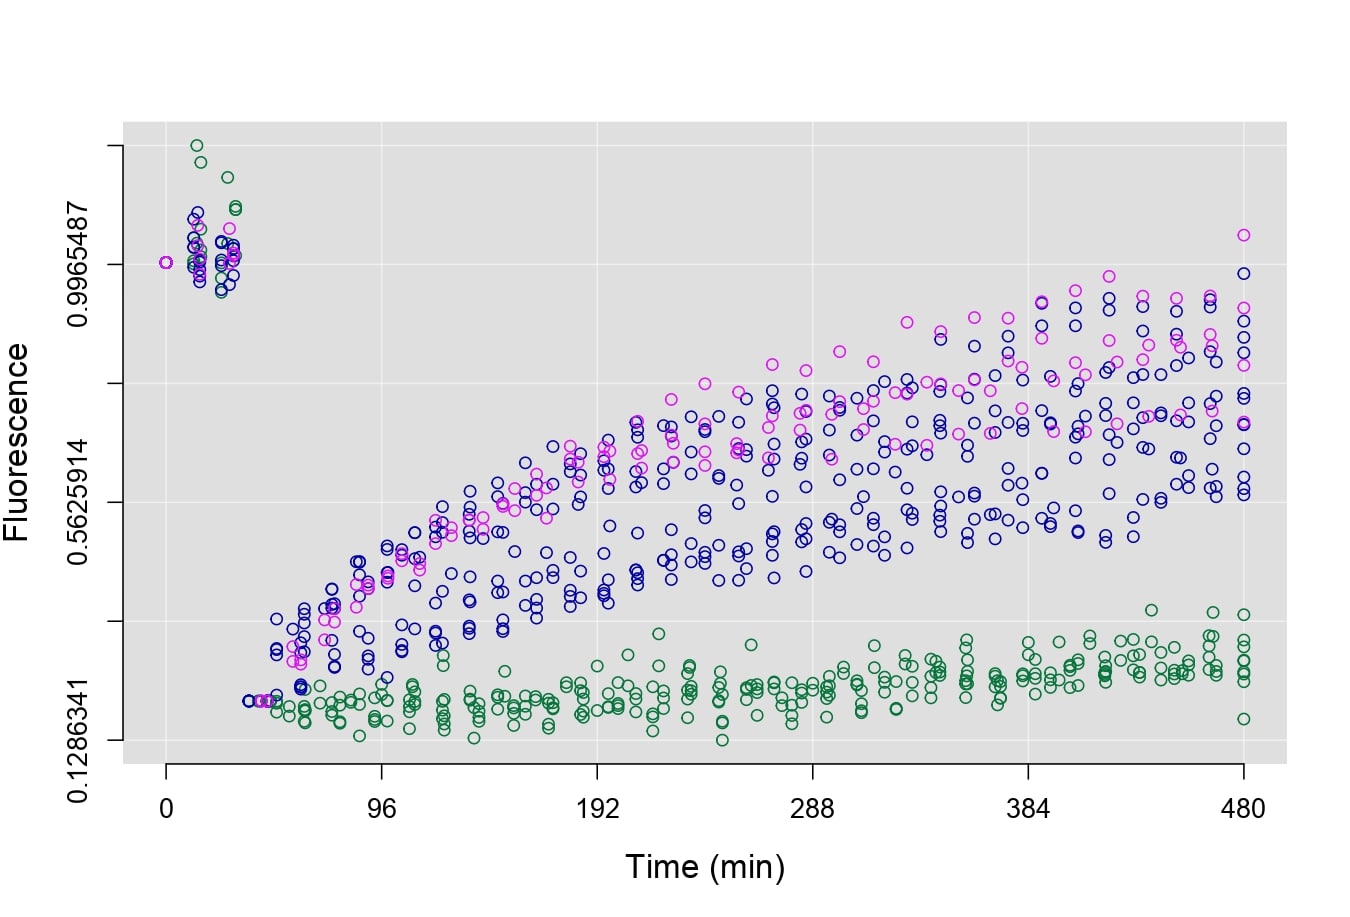
C$setColor("#E014F7")Before performing a parametric fitting, you might prefer to visualize the data through plots for visual inspection. To achieve this, you can use the plotRecover function, which takes the bases created with newDataFrap as parameters. You can customize the plots using various parameters. For more details about this function, refer to plotRecover.
plotRecover(A, B, C, plot.lines=T)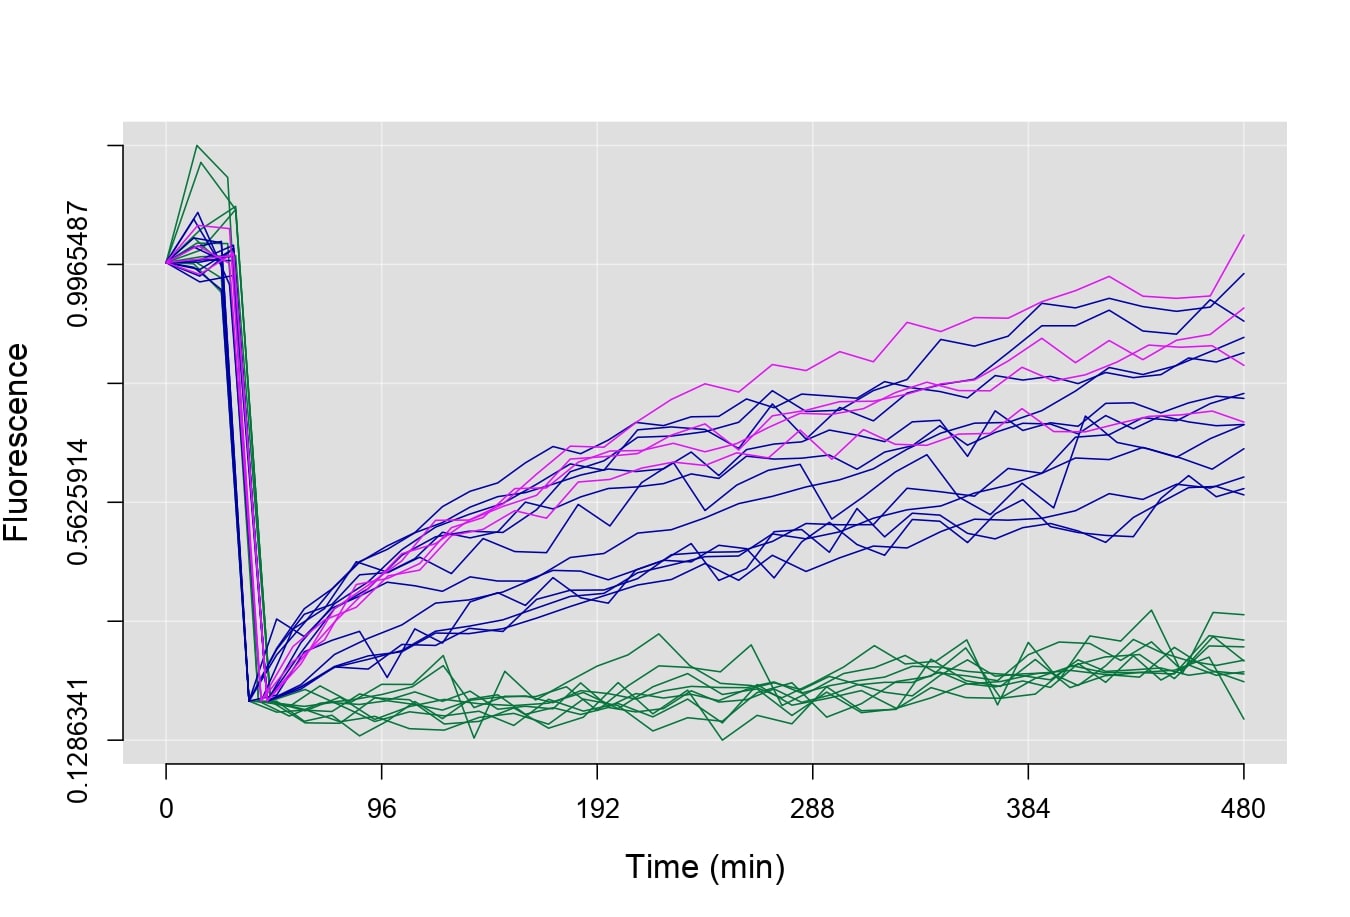
plotRecover(A, B, C, plot.shadow=T, plot.mean=T)