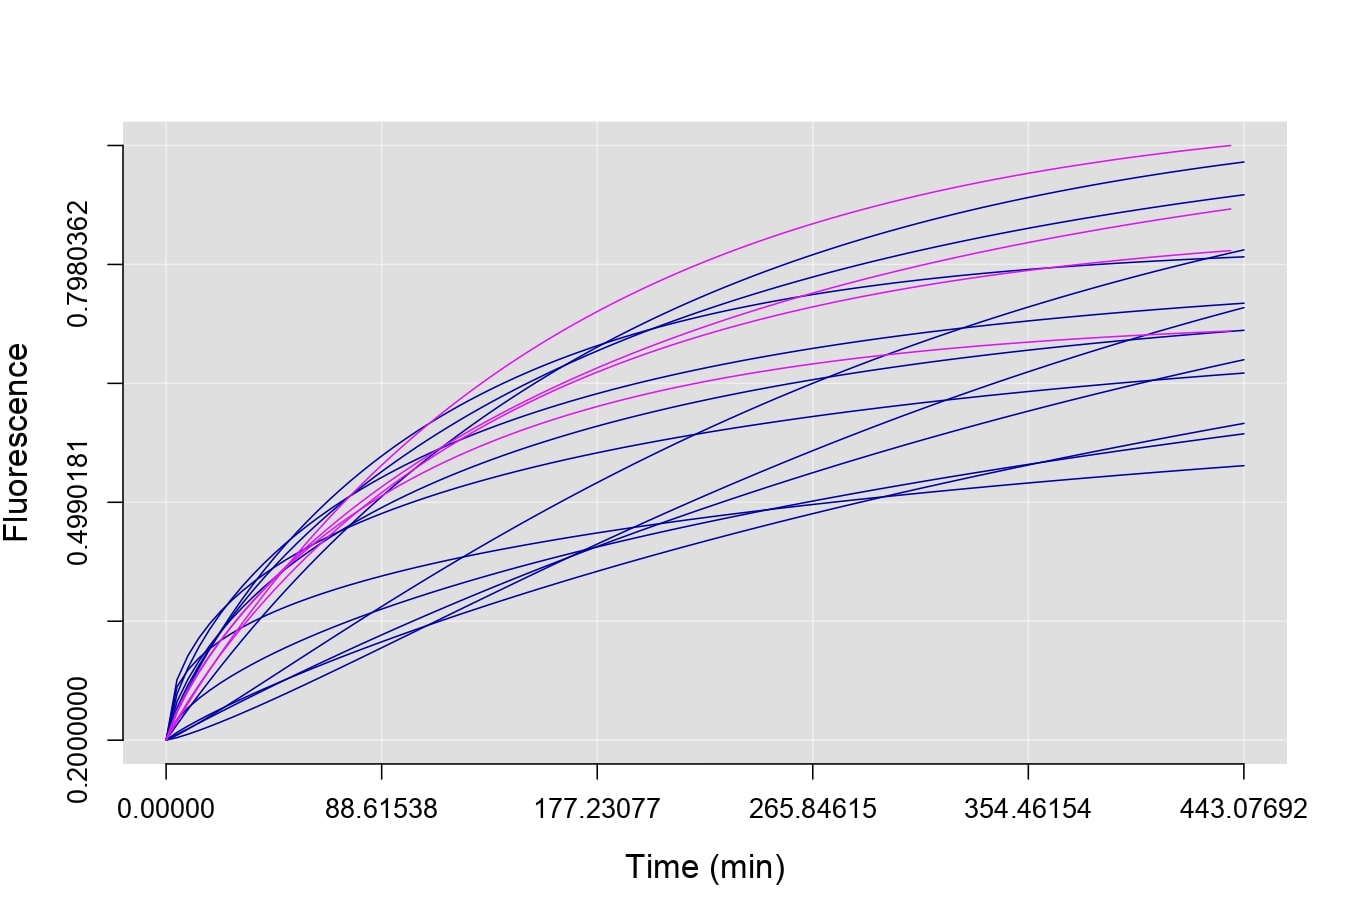
plotFit(B, C, fit=Wei, plot.lines=T)Fit a parametric model
For this particular case, the Weibull model yields better results. Therefore, the Wei function is used to perform the corresponding fitting of the data. The Wei function, applied to a specific data group, returns a list with the information obtained from the parametric fitting, including the estimation of the fluorescence recovery function \(F(t)\) and other relevant data. For more details, refer to newFit.
To plot the parametric fitting of the fluorescence recovery, the plotFit function is used. It takes as parameters the data groups to be fitted and the probability model chosen for each data group. There are also optional parameters that allow customization and formatting of each plot. For more details, refer to plotFit. If the chosen probability model is the same for all data groups, it is sufficient to specify it once as shown below:
plotFit(B, C, fit=Wei, plot.shadow=T, plot.mean=T, alp.shadow=0.2, ylim=c(0.2, 1), xdigits=0)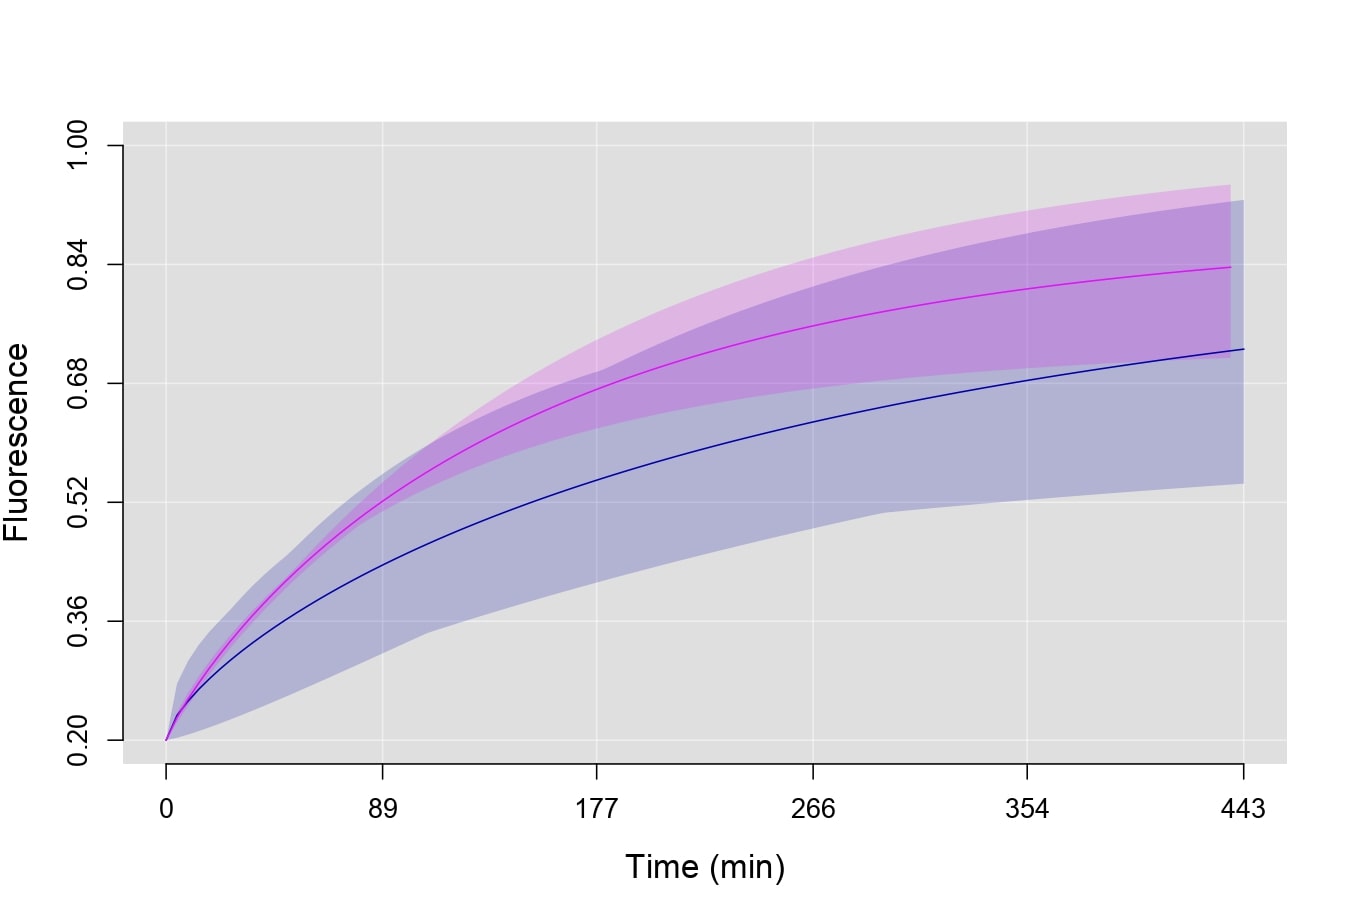
Using the plotFit function, future estimates of the fluorescence recovery curve can be plotted by modifying the range of the graph. The plots obtained from the plotRecover and plotFit functions can be stacked by changing the optional parameter new.plot to FALSE.
plotFit(B, fit=Wei, plot.shadow=T, alp.shadow=0.3, xlim=c(0,500), ylim=c(0.2, 1))
plotRecover(B, AB=T, plot.lines=T, new.plot=F)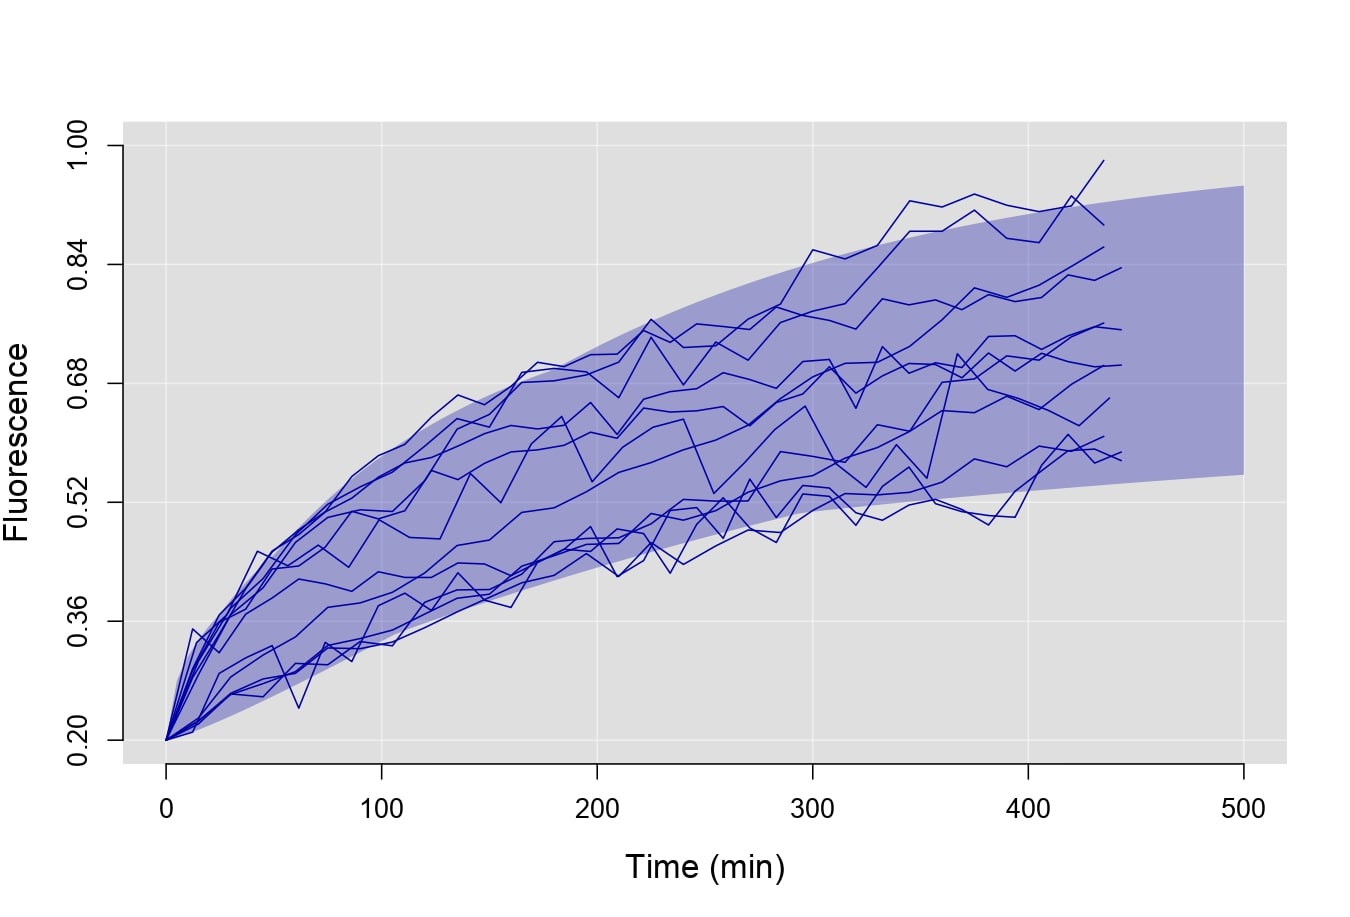
Another use for the plotFit function is to visually compare two or more probability models on the same data group.
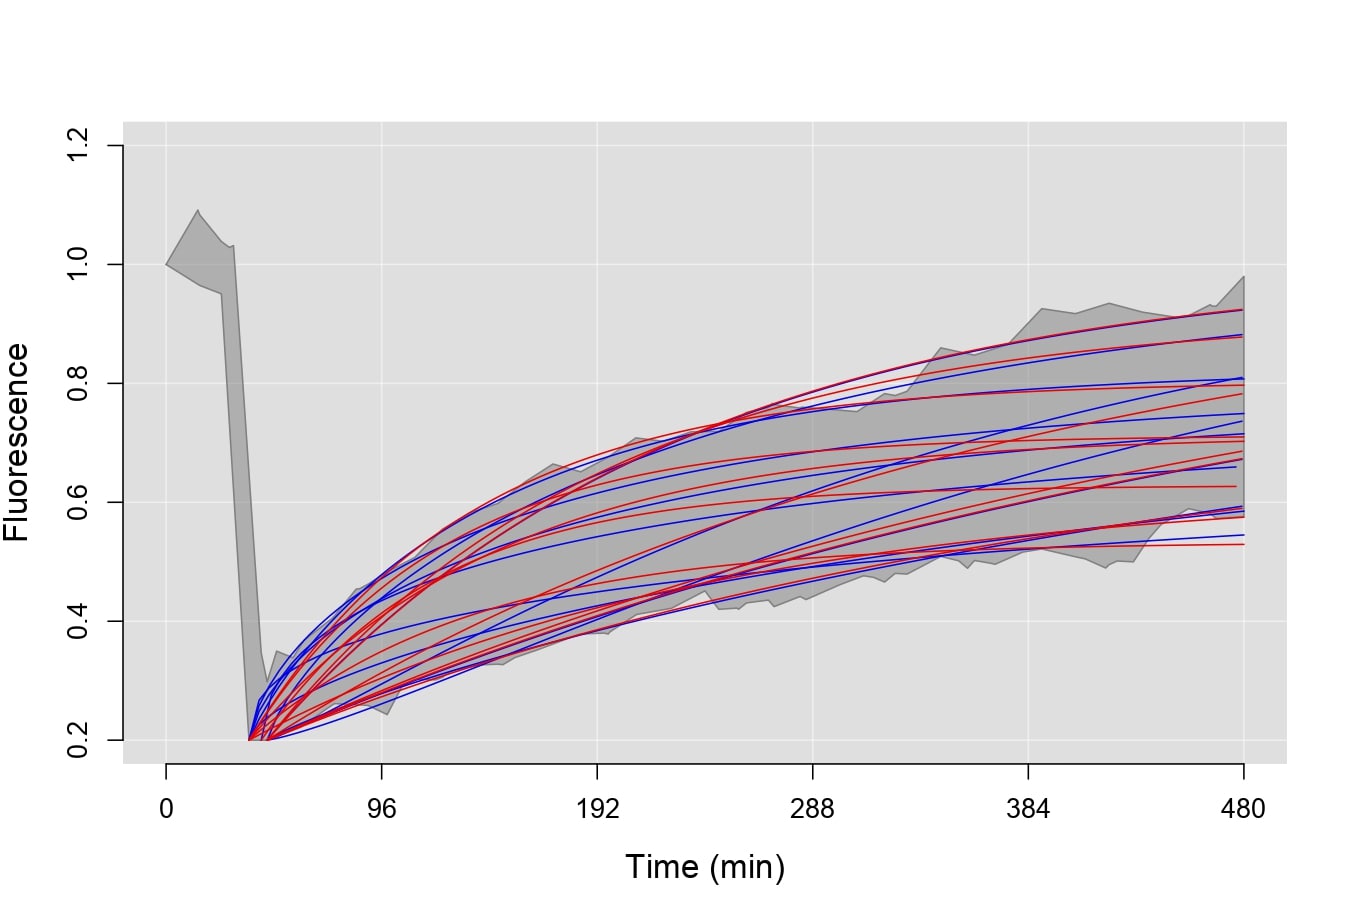
plotRecover(B, plot.shadow =T, ylim=c(0.2, 1.2), xdigits=0,lwd.border=1, col="#808080")
plotFit(B, B, fit=l(Wei, Exp), plot.lines=T, new.plot=F, displacement=T, col=c("blue2","red2"))