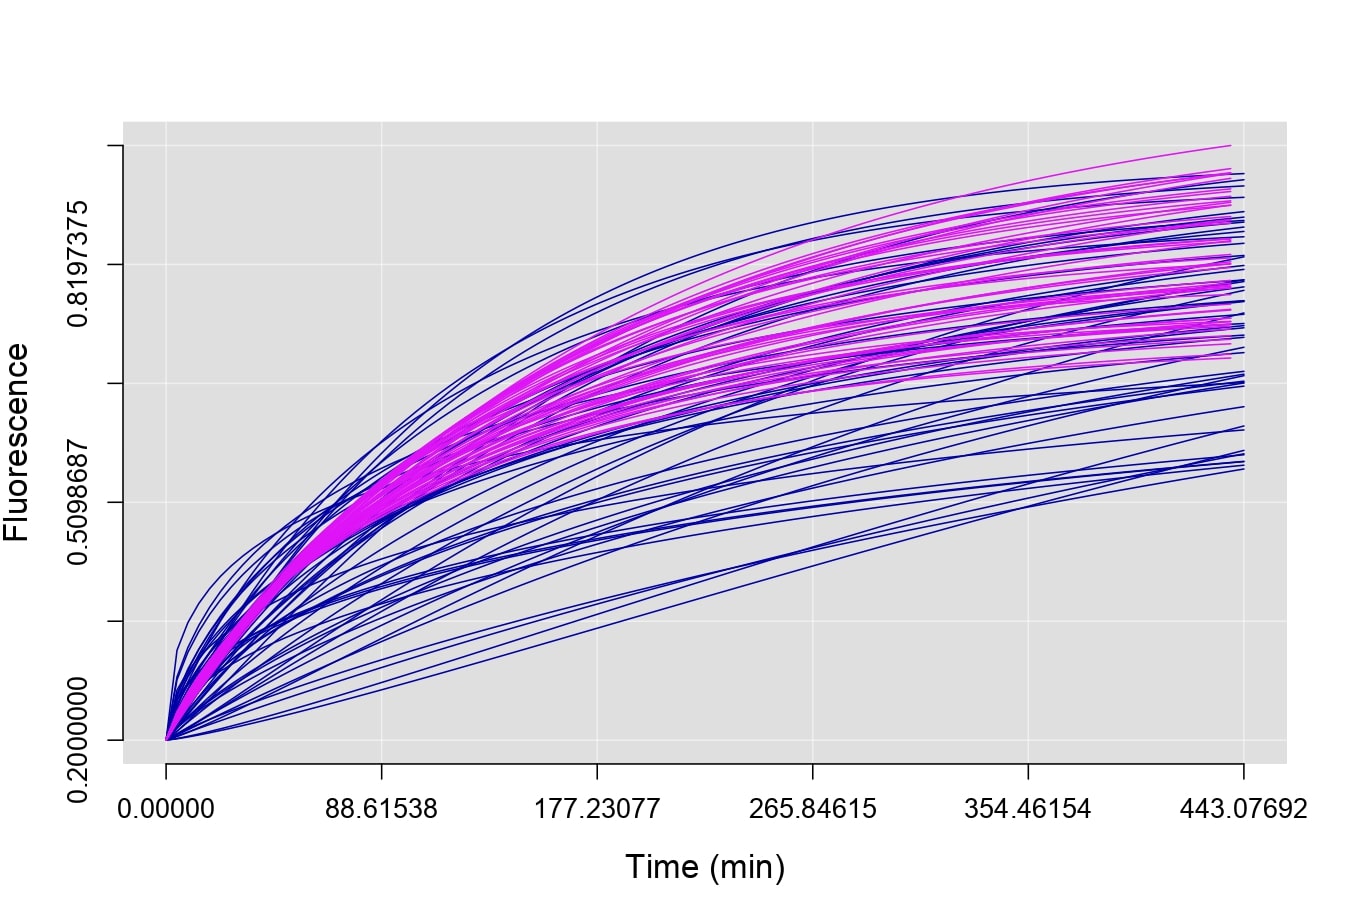
plotFit(B, C, fit=Wei, simulated=T, plot.lines=T)Simulation
The implementation of simulation methods for fluorescence recovery analysis is one of the main contributions of this work. Simulation allows you to increase the sample size without altering its central tendency and dispersion measures. This is especially useful in cases where the sample size is not sufficiently large. Remember that hypothesis tests that rely on limit processes are particularly sensitive to sample size. Additionally, the simulation process is informed by an appropriate choice of the probability model, as explained later.
The simulation of the fluorescence recovery model \(F(t)\) is achieved by simulating the parameters \(\Theta\) of the probability model \(p(t|\Theta)\). Refer to the appendix for more information. The simFit function allows you to simulate data fitted to a probability model. It takes a group of data fitted to a probability model as a mandatory parameter, and optional parameters such as the size of the simulated sample and a simulation seed.
For the case of the Weibull fit, the data simulation is performed as follows: simFit(Wei(B)) and simFit(Wei(C)). For more specific information about the data generated by this function, refer to simFit.
Furthermore, the plotFit, compareParam, and compareMean functions have the simulation method implemented. To access this feature, you need to change the simulated parameter to TRUE. We can replicate the previously made graphs now with simulated data:
plotFit(B, C, fit=Wei, simulated=T, plot.shadow=T, plot.mean=T, alp.shadow=0.2, ylim=c(0.2, 1), xdigits=0)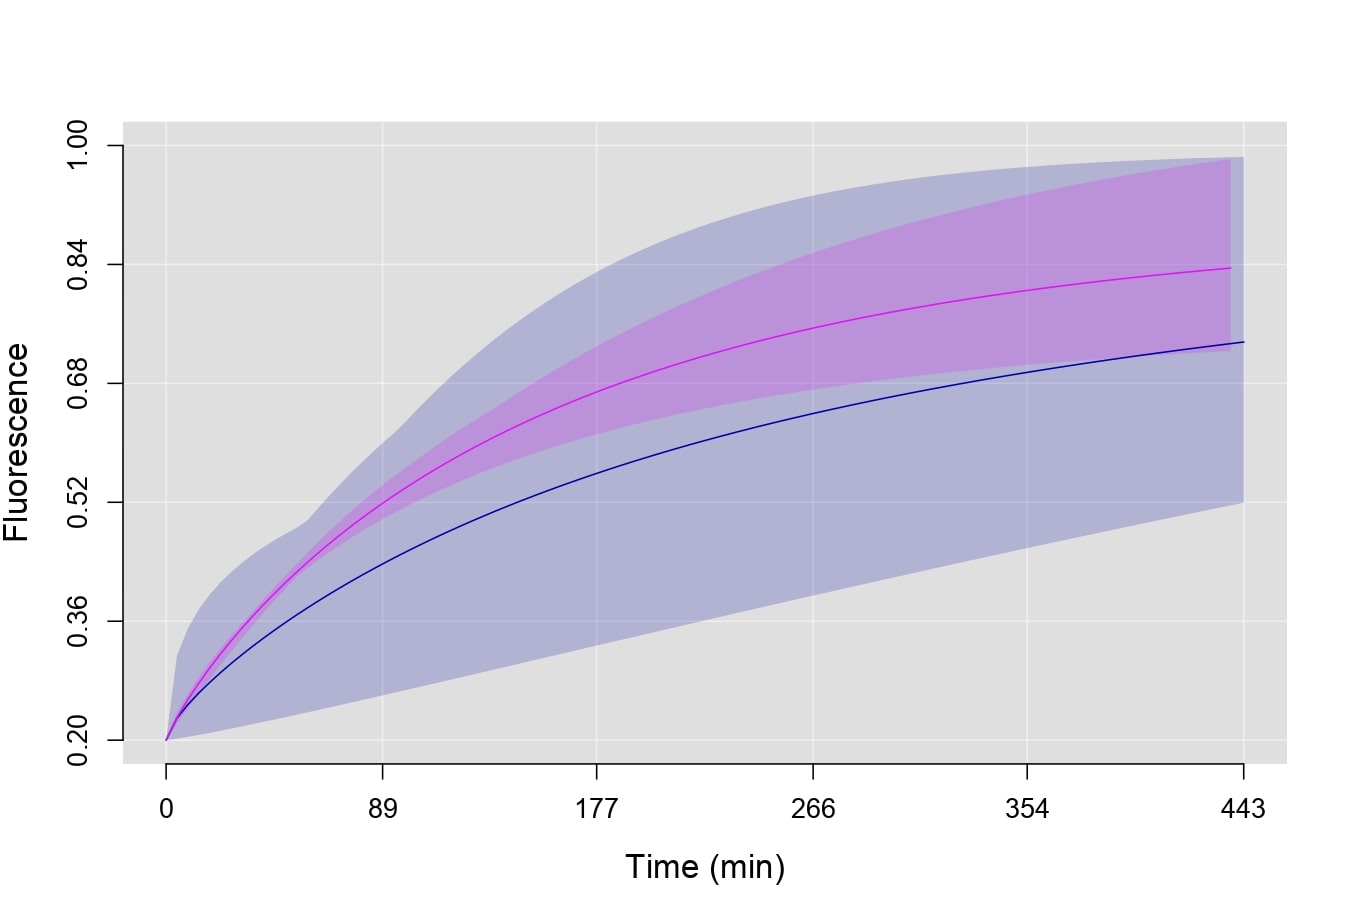
plotFit(B, fit=Wei, simulated=T, plot.shadow=T, alp.shadow=0.3, xlim=c(0,500), ylim=c(0.2, 1))
plotRecover(B, AB=T, plot.lines=T, new.plot=F)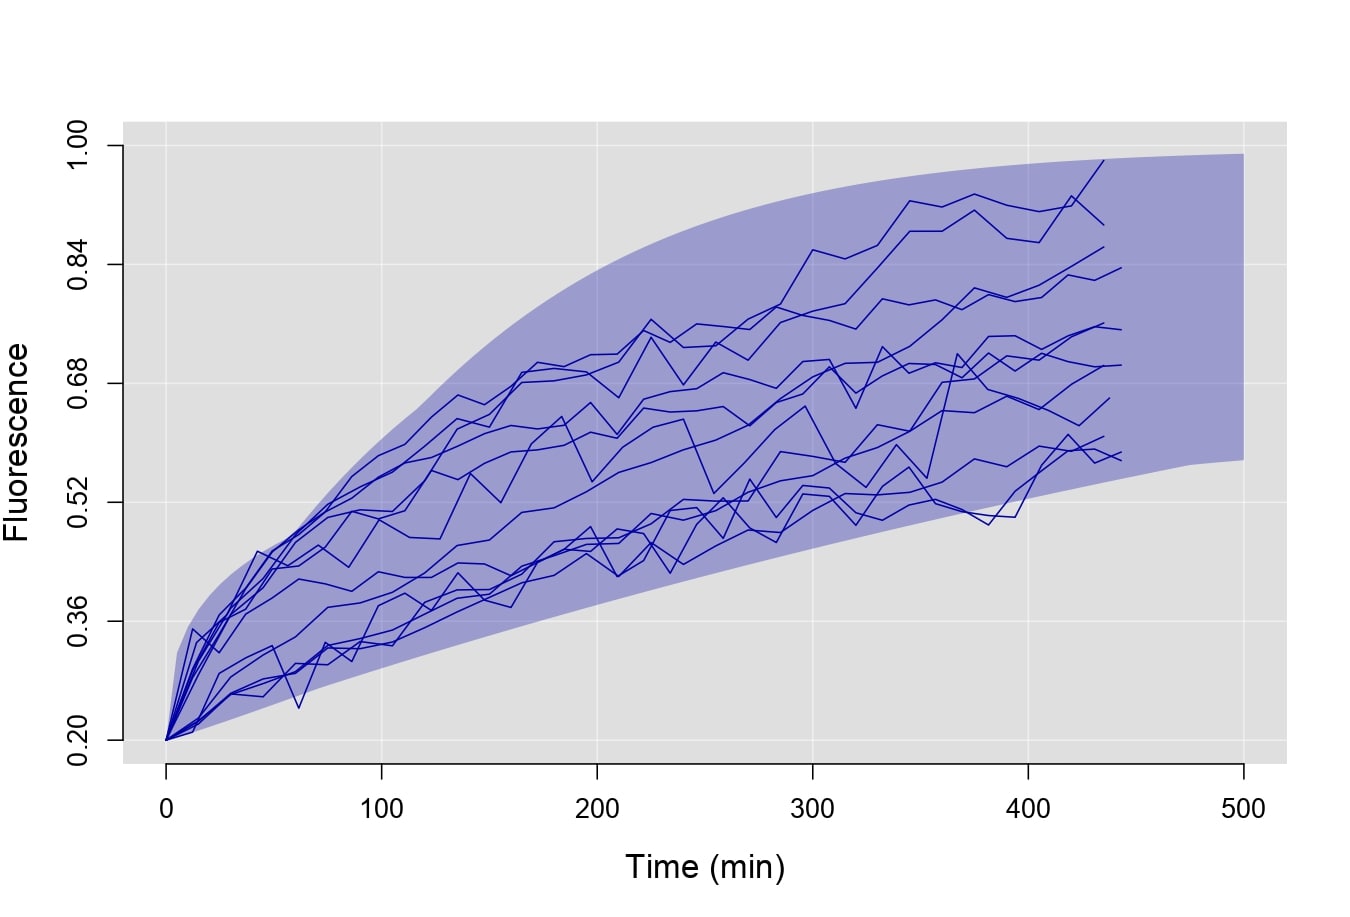
plotRecover(B, AB=T, plot.shadow=T,ylim=c(0.2, 1.2), xdigits=0,lwd.border=1, col="#808080")
plotFit(B, B, fit=l(Wei, Exp), simulated=T, plot.lines=T, new.plot=F, displacement=T, col=c("blue2","red2"))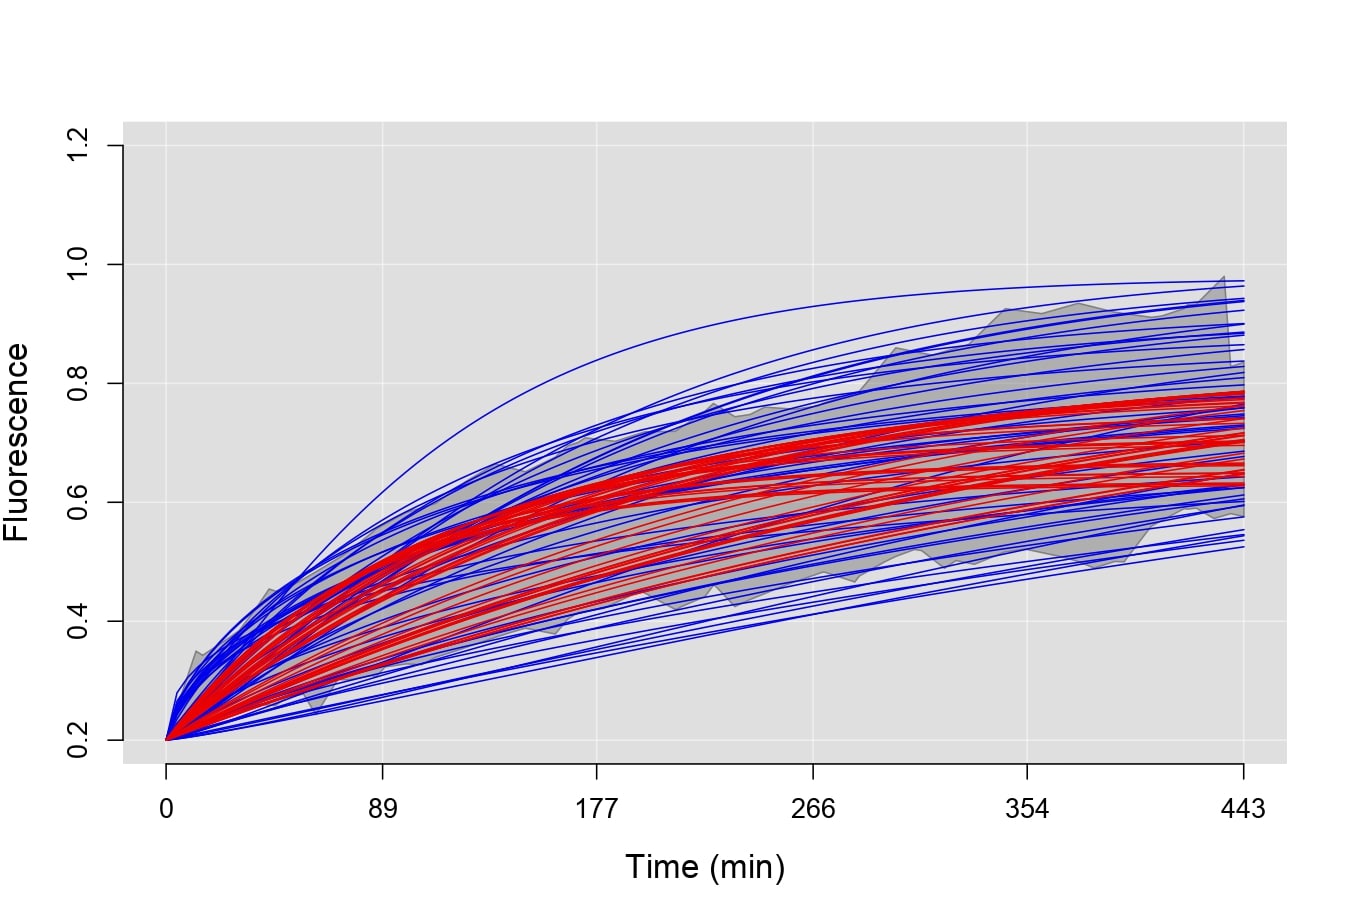
compareParam(B, C, fit=Wei, simulated=T, param="shape")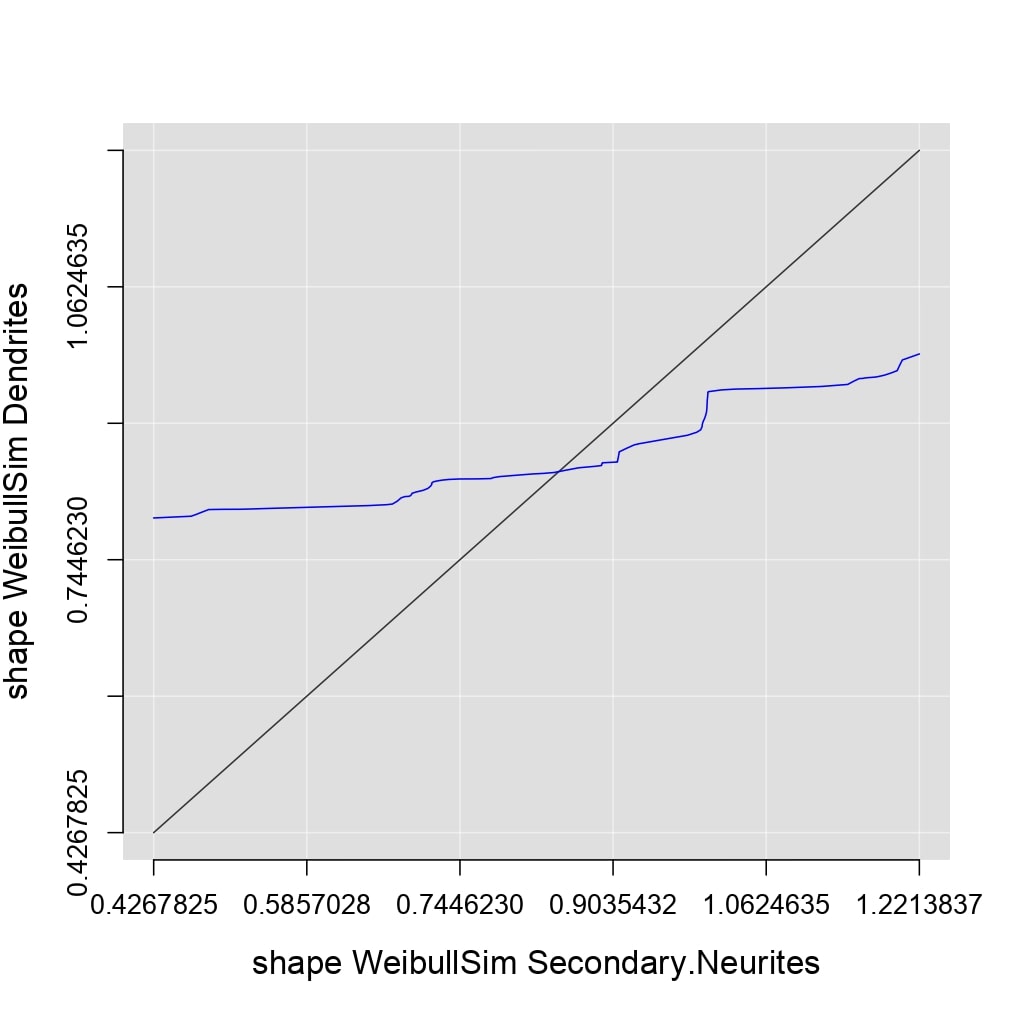
compareParam(B, C, fit=Wei, param="UF", simulated=T, xlim=c(0,1), ylim=c(0,1),

lty.lines=c(2,1), col.lines=c("white","red"), lwd.lines=2)
compareParam(B, C, fit=Wei, param="MF", simulated=T, new.plot=F, lwd.lines=2)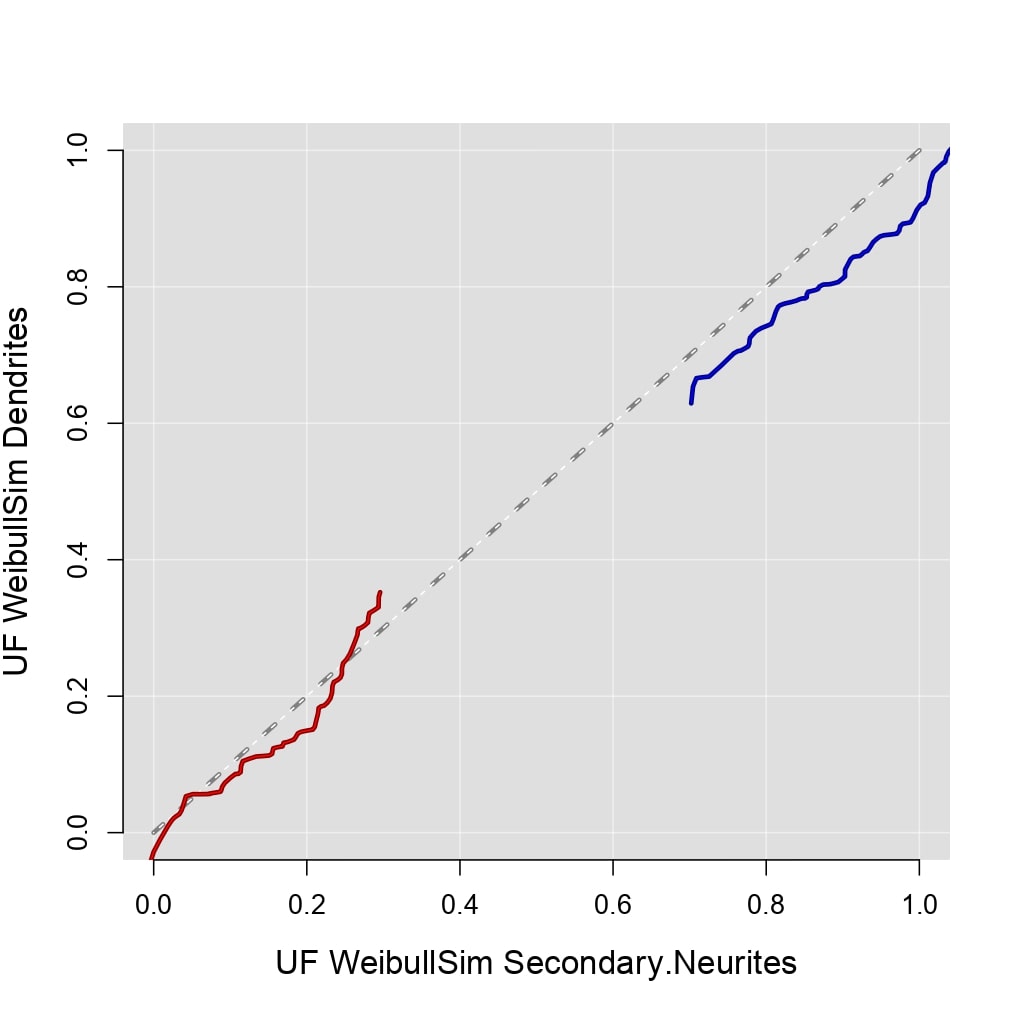
compareParam(B, C, fit=Wei, simulated=T, param="UF", return=T)##
## Welch Two Sample t-test
##
## data: UF_WeibullSim_Secondary.Neurites and UF_WeibullSim_Dendrites
## t = -1.4645, df = 97.842, p-value = 0.1463
## alternative hypothesis: true difference in means is not equal to 0
## 95 percent confidence interval:
## -0.0891179 0.0134351
## sample estimates:
## mean of x mean of y
## 0.07055279 0.10839419compareParam(B, C, fit=Wei, simulated=T, param="MF", return=T)##
## Welch Two Sample t-test
##
## data: MF_WeibullSim_Secondary.Neurites and MF_WeibullSim_Dendrites
## t = 1.4645, df = 97.842, p-value = 0.1463
## alternative hypothesis: true difference in means is not equal to 0
## 95 percent confidence interval:
## -0.0134351 0.0891179
## sample estimates:
## mean of x mean of y
## 0.9294472 0.8916058plotFit(B, fit=Wei, simulated=T, plot.lines=T, plot.mean=T, col.mean="purple",lwd.mean=2, xdigits=0, ydigits=2, alp.lines=0.5)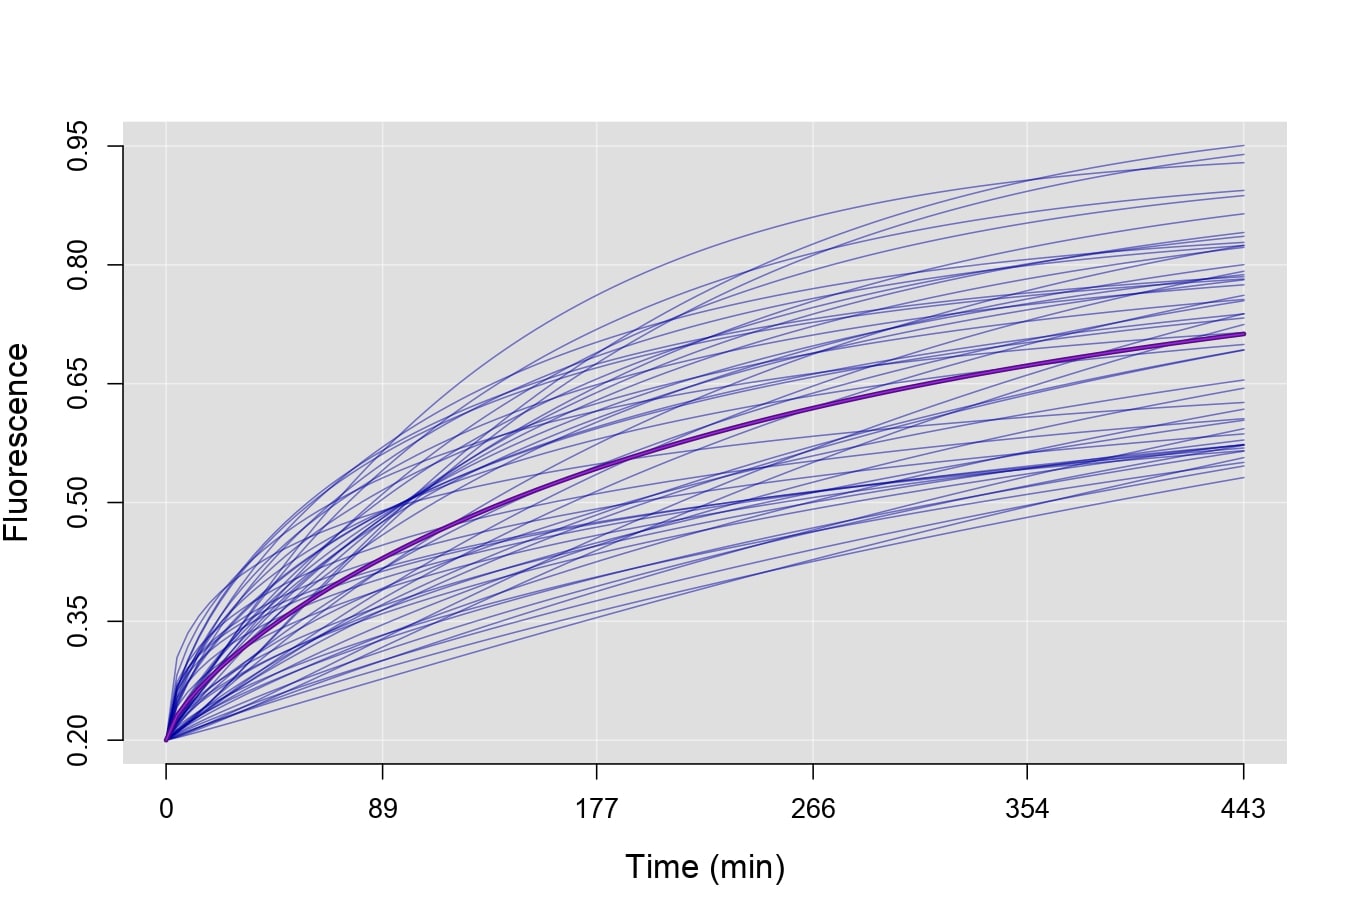
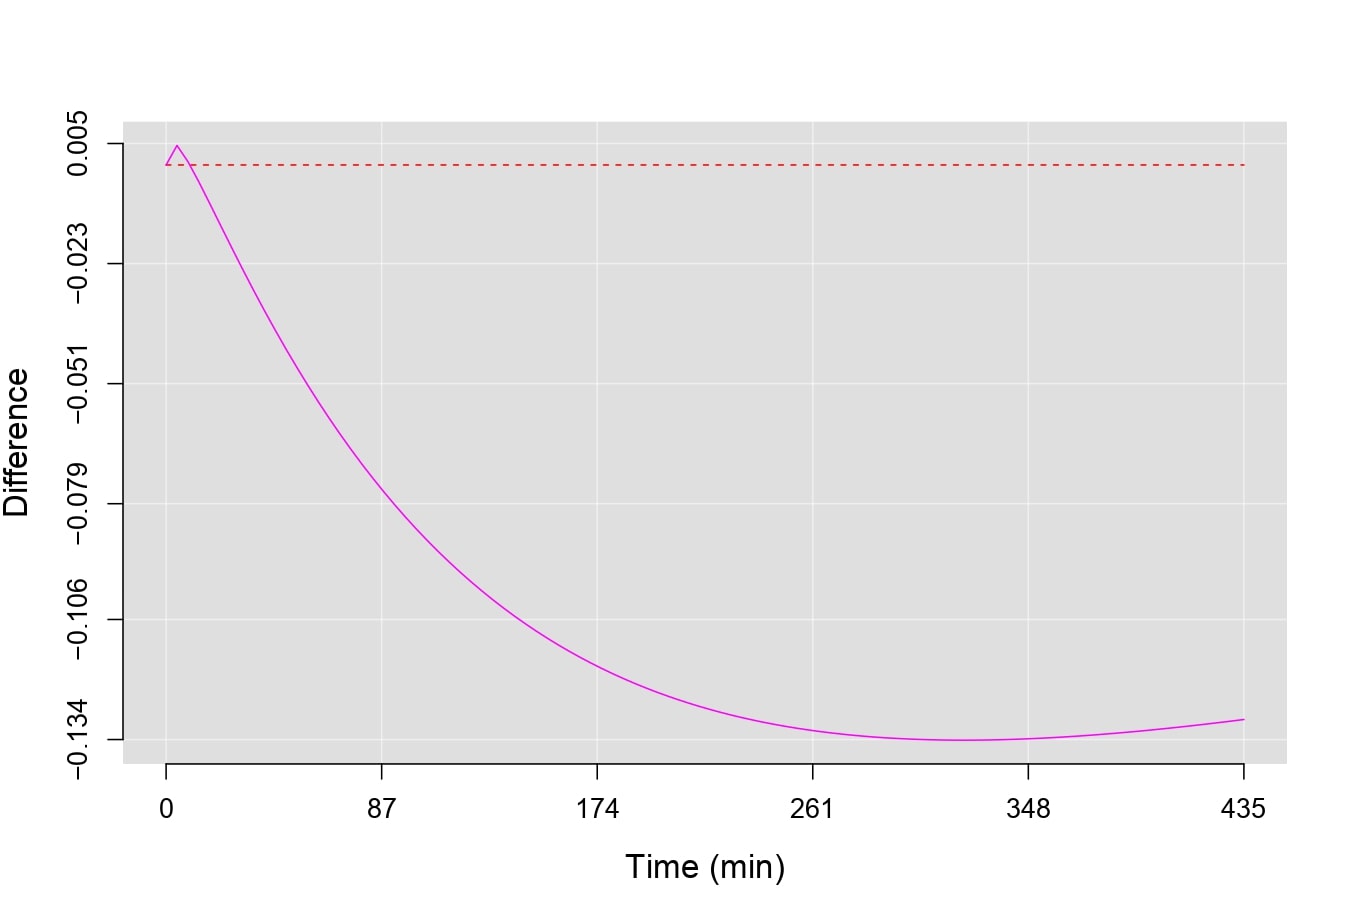
compareMean(B, C, fit=Wei, simulated=T, lty.lines=c(2,1), col.lines=c("red","purple"), ydigits=2)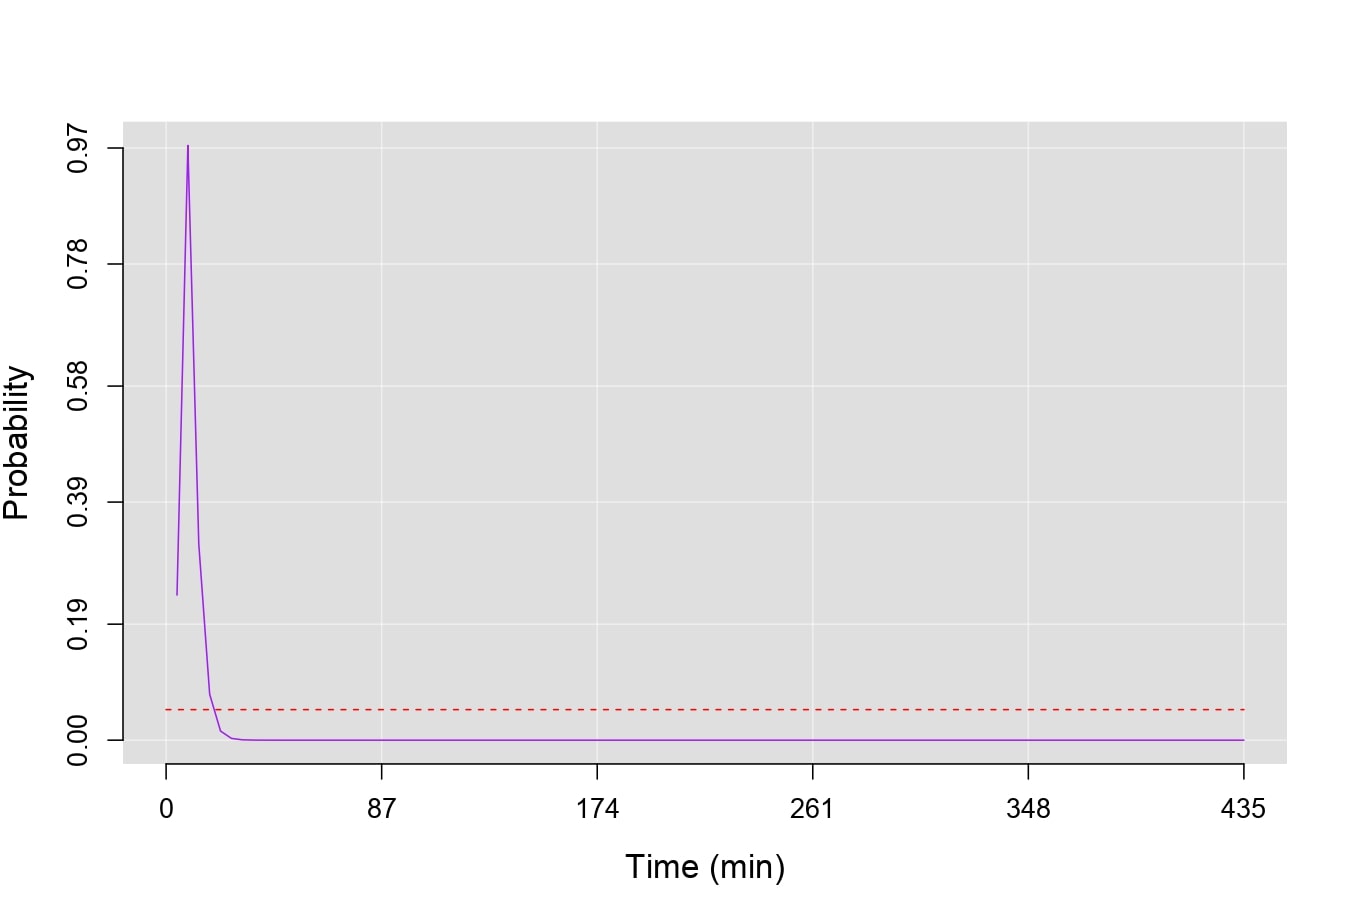
compareMean(B, C, fit=Wei, simulated=T, p.value=F, lty.lines=c(2,1), col.lines=c("red","magenta"), ydigits=3)