Exp<-newFit("Exponential", pexp,"rate", list(c(0,1)))
Gam<-newFit("Gamma", pgamma, c("shape","rate"), list(c(0,5), c(0,5)))
Wei<-newFit("Weibull", pweibull, c("shape","scale"), list(c(0,5),c(0,2000)))Choose a probability model
The proposed parametric model to describe the behavior of the fluorescence recovery curve from the photobleaching moment is as follows:
\[F(t)=f_{min}+\alpha\,(1-f_{min})\,p(t-t_0|\Theta),\]
where \(p\) is a cumulative distribution function parameterized by \(\Theta\), \(t_0\) is the photobleaching time, and \(f_{min}\) is the minimum fluorescence value after photobleaching. The theoretical maximum value of fluorescence after photobleaching, \(f_{max}\), is defined as:
\[f_{max}= f_{min}+\alpha(1-f_{min}).\]
It can be observed that the function \(F(t)\) is defined in the time interval \(t\in[t_0, \infty)\). Similarly, the function \(F^{AB}(t)\) is defined to represent the fluorescence recovery curve after photobleaching, and it is defined in the time interval \(t\in[0, \infty)\):
\[F^{AB}(t)=f_{min}+\alpha\,(1-f_{min})\,p(t|\Theta).\]
More information about the construction of the model can be found in the appendix of this document. In order for the user to perform the parametric fitting for subsequent data analysis, the user only needs to choose the most appropriate probability model, \(p\). The newFit function allows the declaration of a new probability model. The function takes parameters such as the name of the model, the cumulative distribution function, the names of the probability function parameters, and a list with the value ranges for those parameters. For more details, refer to newFit.
One of the most important criteria for choosing between different probability models is the mean squared error. Models with lower error should be preferred. The mean squared error is given by the following expression:
\[E_i =\frac{1}{m_i}\sum_{j=1}^{m_i} [f_i(t_j)-F(t_j)]^2,\]
where \(\{f_1,..,f_n\}\) is a group of fluorescence data and \(\{t_1,t_2,\cdots,t_{m_i}\}\) are all the values greater than the photobleaching time quantified for \(f_i\). The compareFit function compares the mean squared error of different probability models fitted to a group of data by creating a Q-Q plot and the histogram of the error for each model. The function takes parameters such as the data group to be compared, a list of the models to be compared, and several customizable parameters for the plot. For more details, refer to compareFit.
compareFit(B, fit=l(Exp, Gam, Wei), col.lines=c("red","yellow"), lty.lines=c(2,1), lwd.lines=2, lwd.mean=2)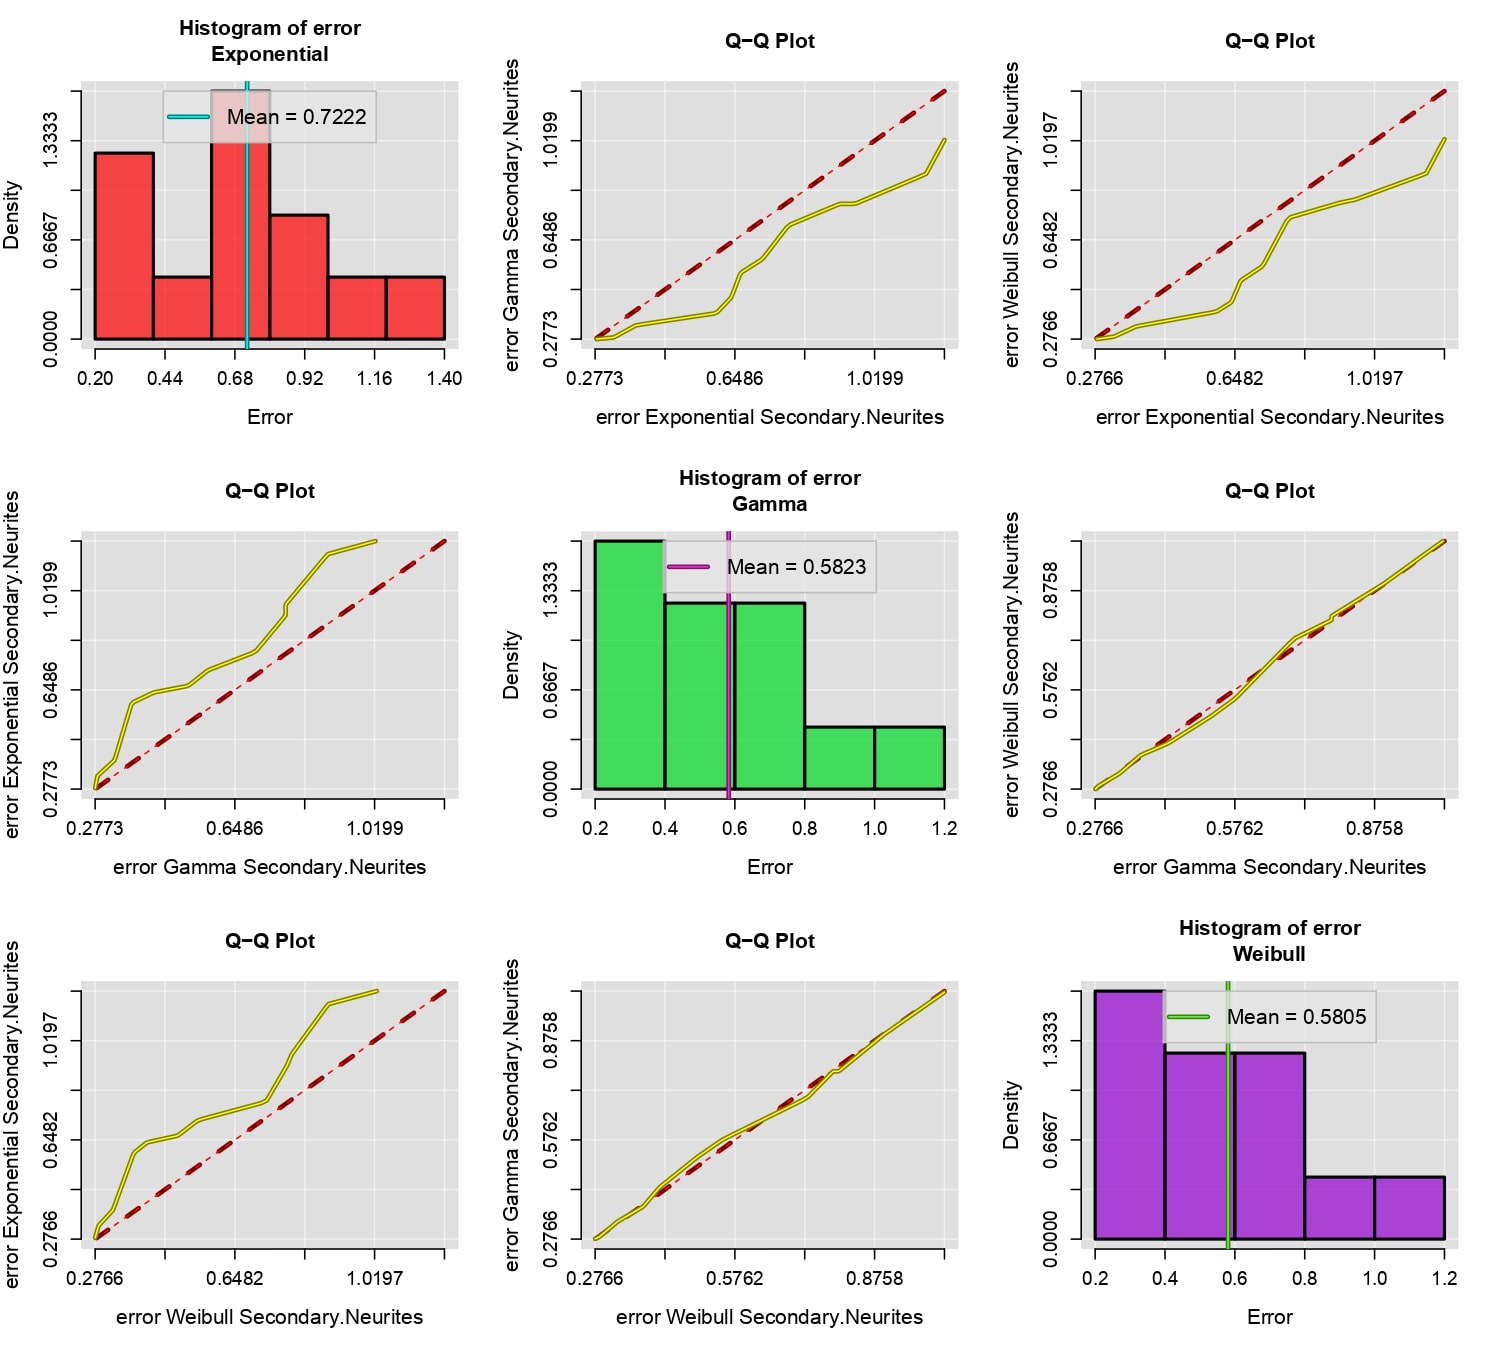
compareFit(C, fit=l(Exp, Gam, Wei), col.lines=c("red","yellow"), lty.lines=c(2,1), lwd.lines=2, lwd.mean=2)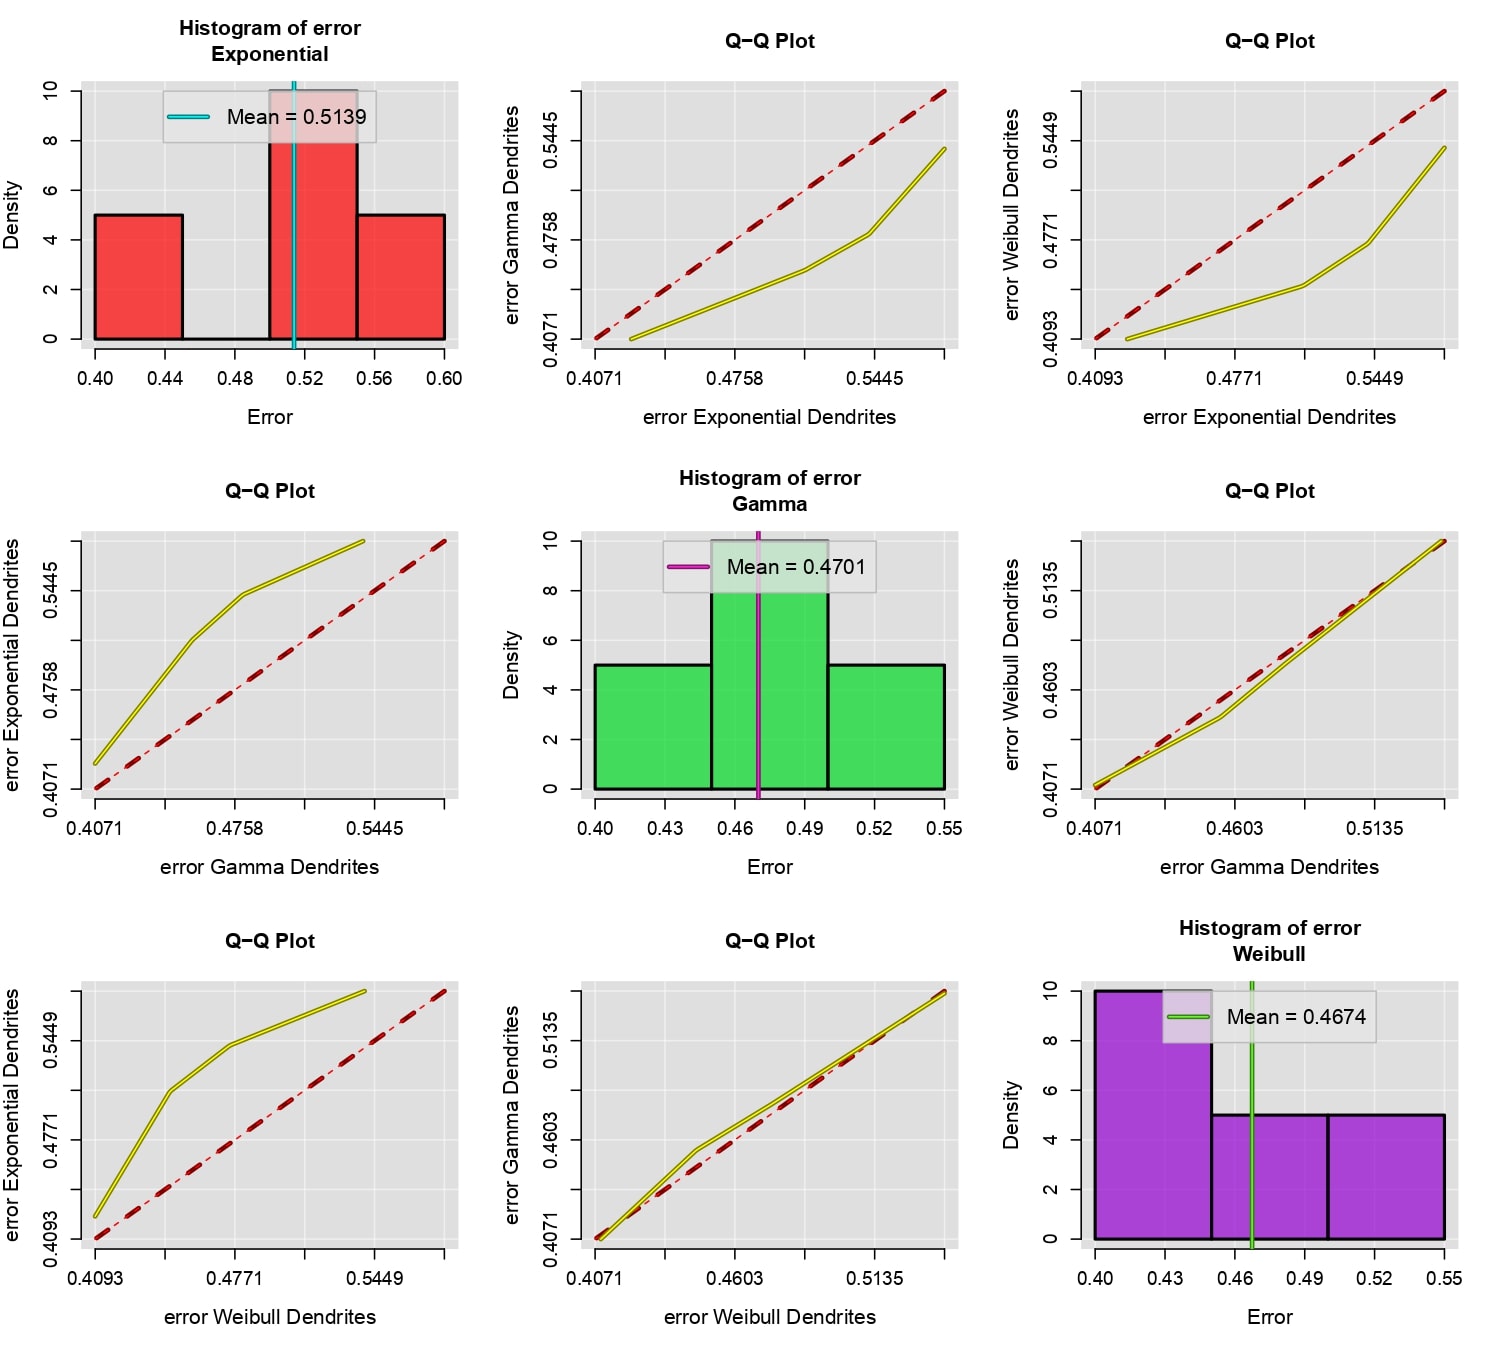
For more information about choosing a good probability model, refer to the appendix.